TabJolt is a free “point and run” load testing tool you can use to
drive load against a Tableau Server.
It was created to be simple to use. If TabJolt were
ice-cream, you’d get to choose between two flavors – not the 31 at Baskin Robbins.
For a basic, light-weight experience, you’d try the vanilla ViewVizLoadTest. ViewVizLoad causes
Tableau to execute vizzes of your choice over and over again with no filtering
or interaction. This test arguably simulates what a lot of your users do when
they execute a viz first thing in the morning – they make sure that the KPIs
they care about aren’t red. Assuming
numbers look fine, your user closes his browser, drinks a little more coffee
and gets on with his day.
The chocolate InteractViewLoad
test simulates someone who not only renders a viz, but then begins
interacting with it. That user might filter the viz, select marks, or do both.
TabJolt understands how “Tableau works under the covers” so handle this interaction quite easily on your behalf. InteractViewLoad is like the power user who launches a
viz and then goes hunting for root cause of a problem she’s discovered.
While I love both chocolate and vanilla, they can get a bit
boring after a while. It would be nice to be able to mix these test type flavors
and do things like introduce think time into
the tests to simulate a little bit more closely what happens in the “real world”
of Tableau.
Since TabJolt is built with Apache JMeter, you can customize these tests as much as you want – you just have to
know how.
I’m going to show you how.
Thanks and warnings
Just as TabJolt is unsupported, so are the
techniques I’m about to show you. We’re playing with 3rd party technology
used to test Tableau, not Tableau itself. Please don’t call Tableau Technical
Support with questions about this stuff.
The Tableau Server Administration community could be a good place to go if you get stuck, but realize you are a bit alone in the wilderness when you go off road like this. You might run into a fellow traveler on the forum who can help you, or you might not.
Many thanks to Kaifeng and Akber from the Product Testing team. They were super-patient with the questions I had while tinkering with this stuff.
Prerequisites & Configuration
Before you can hack TabJolt, you must install and configure it. You can find the bits and Installation guide via the first link at the top of this post. Or, you can go right to GitHub Please make sure you have TabJolt running dependably with “built-in tests” before you attempt any of the advanced stuff. Need something above and beyond the “included” configuration guide? This great walkthrough from Lee Bond-Kennedy is awesome.
Apache JMeter
You need JMeter for this work (or a good XML editor – but JMeter is easier). Download it here:
http://jmeter.apache.org/download_jmeter.cgi
JMeter Plugins
The tests we’re going to modify evidently use functionality that is part of the JMeter Standard Plugins distribution. Download JMeterPlugins-Standard-<latest version>.zip here:
http://jmeter-plugins.org/downloads/all/ (FYI, I used v1.21)
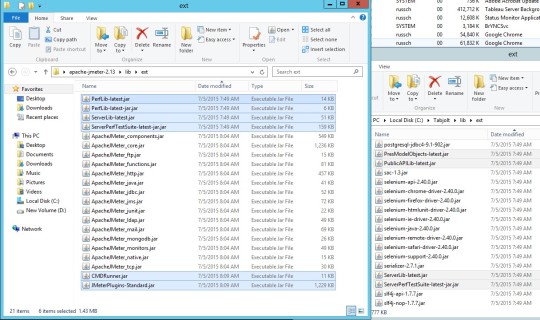
After you have JMeter unzipped and installed, open the plugin zip file as well. Inside the /lib/ext folder of the archive, you need to find the following .jar files:
- JMeterPluginsCMD.jar
- CMDRunner.jar (not sure if this one is strictly necessary, but I grabbed it just in case)
Copy these files into the /lib/ext folder of your JMeter install. If you don’t, you’ll get an error message like this when you open any of the tests included with TabJolt:

Other Dependencies
TabJolt tests leverage several classes that JMeter can’t “see” unless you copy the .jar files which contain the classes into /lib/ext…or use the JMeter search_paths property found in the jmeter.properties file.
I tried pointing search_paths to the /lib/ext folder of the TabJolt distribution, which is where these “other” files live. However, I couldn’t get things to work dependably on both the Mac and Windows…so I ended up copying files instead.
Copy the following “Tableau-specific” files from <TabJolt Install Folder>/lib/ext to the <JMeter Install Folder>/lib/ext and everything Tableau-related should be ready to go.
- PresModelObjects-latest.jar
- PublicAPILib-latest.jar
- ServerLib-latest.jar
- ServerPerfTestSuite-latest-jar.jar

Logging Files
Oh yeah, one more thing. I got this error if I didn’t copy the two log4J files from TabJolt’s lib/ext folder into JMeter’s /lib/ext:

Here are the files:
- log4j-1.2.16.jar
- log4j-1.2.17.jar

This error didn’t stop me from doing work, but it was a little annoying…so you now know the secret of how not to be annoyed: You’re welcome.
Now you should be ready to use JMeter to open up tests found in the /testplans folder of TabJolt. To launch JMeter, double-click /bin/ApacheJMeter.jar.
Exploring Test Plans
First, let’s open a plan – we’ll start with the chocolate InteractVizLoadTest.jmx file in tabjolt/testplans

Below, you can see several thread groups:
- A thread group which “sets up” the test
- InteractVizThreadGroup, which runs the actual test
- Several disabled threads groups which probably should have been removed since they aren’t doing anything
Note the User Defined Variables, too – specifically ThreadGroup1Weight and ThreadGroup2Weight. We’ll use these later.

If we select the InteractVizThreadGroup, we can see some information about the number / percentage of vusers that will execute this test. The ThreadGroup1Weight variable is being used, and since the value of this variable is currently “1”, ALL tests will be executed by this thread group. I bet the wheels are turning in your head already, huh? What would happen if I change this value? Interesting thought…

If we open up the thread group, you’ll see a single Java Request is being made. The actual request is carried out by “Tableau-ware” – a class / function that Tableau built specifically to render and interact with a viz in JMeter. If the Classname you’re looking at says anything other than com.tableausoftware.test.server.perfTestSuite.InteractVizTest, then it means JMeter can’t “see” the TabJolt-specific classes I wrote about earlier.
If this is the case, DO NOT SAVE THE TEST (I learned this hard way). Close JMeter, fix your configuration by copying files, and try again. If you save the test in a state where we’re not referencing com.tableausoftware.test classes, you’ll break it.

There are various thing you can do with a thread group and the items inside it. I’m going to go ahead and remove the two disabled thread groups to clean things up a bit.

Here’s my nice clean test. I’ve already saved it as 1- InteractVizLoadTest.jmx

Next, we should run this test. I use TabJolt to do so with 5 users for 5 minutes. Realistically, I’ve made no real changes to how the test will behave. I just deleted some hidden stuff that wasn’t getting executed to begin with.
Here’s a quick (11-ish second) view of my 8 core under load:

Now, we go off road.
I want to add some think time to my test so that it more closely mimics the way human beings work with a viz – they view it, ponder, click something, think again, click something else, etc.
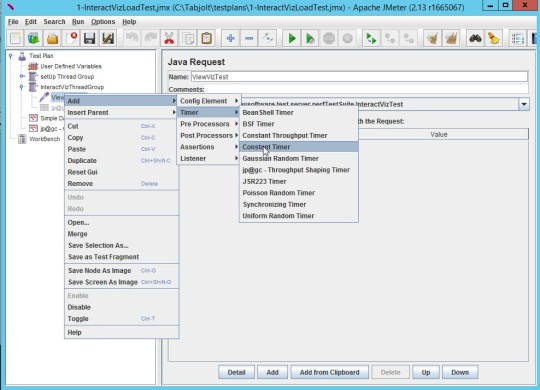
We’ll add think time with a Constant Timer:

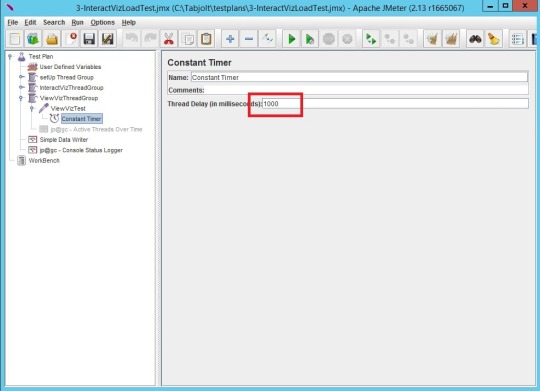
I’m going to hard-code a 5 second (delay – pause – think time). If I were really motivated, I could randomize this value with a JMeter Random Variable. In essence, I’d add this variable by right-clicking higher in my tree, choosing Add | Config Element | Random Variable, and referencing in Thread Delay property, But, I’m not bothering!

I’ve saved this sucker as 2 – InteractVizLoadTest.jmx
Let’s run it again! Same number of vusers, same workload, same test length in minutes. Here I am executing the test from the command-line:

….and here it is running on my server.

Do a quick comparison of CPU utilization with and without thinktime. Even without looking at numbers, it’s pretty clear the machine is “less stressed”.
To finish things off, I’ve decided to add a second thread group that executes a vanilla ViewVizLoadTest. I’ll then split the work between the original, “stressful” test and this “kinder” view-only test.
The first thing we’ll do is change the values for ThreadGroup1Weight and ThreadGroup2Weight to 30% and 70%. The current “heavy” thread group will get 30% of the test’s work, and the lighter-weight thread group which I still need to create will handle the other 70%.

We can easily duplicate the original thread group, and then just modify its name and what it does. I found this be best approach as it made it less likely I fat finger something by mistake.

As you can see, I’ve given the parent thread group a different name, and I changed the “thread group weight” variable that is referenced by Number of Threads.

Next, I’ve also renamed the name of the Java Request and most importantly, I’m choosing a different test for my Tableau classes to execute. I am no longer executing the InteractVizTest. I’m telling Tableau’s code to do something else – to run the ViewVizTest instead. Don’t forget this part!

For kicks, I also reduced the duration of think time on the View tests – No real reason why, I just felt like it.

So, let’s execute THIS test with TabJolt using 5 virtual users. Pay close attention to what happens below:

6 threads?! I thought we were supposed be running with 5 users…Why are we seeing 6 threads? Because, math:
.3 * 5 = 1.5 (round up to 2)
.7 * 5 = 3.5 (round up to 4)
Lesson learned – don’t be surprised if you don’t always get exactly the number of threads you’re expecting. I suspect I could fix this up simply by going with Math.floor instead of Math.ceil in the original expression..

Why don’t you try it and let me know what happens?
Anyhow, here’s the obligatory task manager shot of the 5 (actually 6) users running the final workload. I spent $4.99 on an animated .gif generator this morning, and I’m getting my money’s worth:

Let’s finish off with some high-level metrics as reported by TabJolt on each one of our tests. The Run ID’s of my tests are:
10 – Cleaned up Interact test (Purple)
11 – Cleaned Up Interact test with 5 second think time (Pink)
12 – 30/70% Mix with 5 second think time for Interact, 1 second for View (Grey)

Total Number of Tests completed – Most for Run ID 12, as we’re executing lots of relatively “cheap” view tests. Least for Test 11, as we’re exclusively executing an expensive test, then waiting 5 seconds before doing it again:


Here you can see all tests we fired across each run.

Note that when we filter on “View Viz Test”, we only see tests coming from #12…and plenty of them:

Response time was generally lower for test 12 (View / Interact Mix) because the View tests are cheaper and come back faster:

Finally, here’s a look at CPU and RAM utilization. RAM seems to be about the same across the board, but test 11 (Interact test, no sleep time) is definitely driving the most CPU.

That’s it! Go forth, be fruitful and multiply. If you find or learn something interesting please report back here!
